US domestic crude oil production took off in the past year. Most of the production growth is coming from three shale oil plays – the Bakken, Eagle Ford and Permian basins. A number of factors have combined to allow rising production to continue. Today we review what sustains increased crude production and whether it can continue.
The chart below shows total US domestic crude production since the start of 2009. Around August 2011, the level of production started to ramp up dramatically. Despite a brief respite when crude prices fell below $80 / Bbl earlier this year, production is rising again. The latest data from the Energy Information Administration (EIA) shows that between September 2011 and July 2012, production increased from 5.6 MMb/d to 6.3 MMb/d - that’s a 62 Mb/d production increase every month.
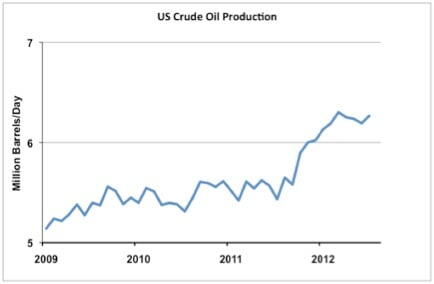
Source: EIA Data from Morningstar
Rig Count and Drilling Efficiency
The US drilling rig count has been rising rapidly since 2009 (see chart below) and has continued to grow. As the price of natural gas fell in 2011 and into 2012 producers began to turn away from dry natural gas. The majority of the drilling rigs freed up from gas production were then moved into crude oil or wet gas (natural gas liquids rich) production.
Between September 2011 and August 2012, the number of rigs drilling for crude increased from 1063 to 1423 – (25 percent). If you look carefully at the chart, you can see signs of the rig count leveling off earlier this summer. However, the rig count number does not tell the whole story. We also need to consider increased rig efficiency. Producers are continuing to report increased rig efficiency in their presentations to investors. Continental Resources (the number 1 Bakken producer) cited completion and drilling efficiencies and multi-well pads as areas for expected savings and their rigs were 40 percent more productive (wells/rig) in 2012 than they were in 2011 (source Investor Presentation).